
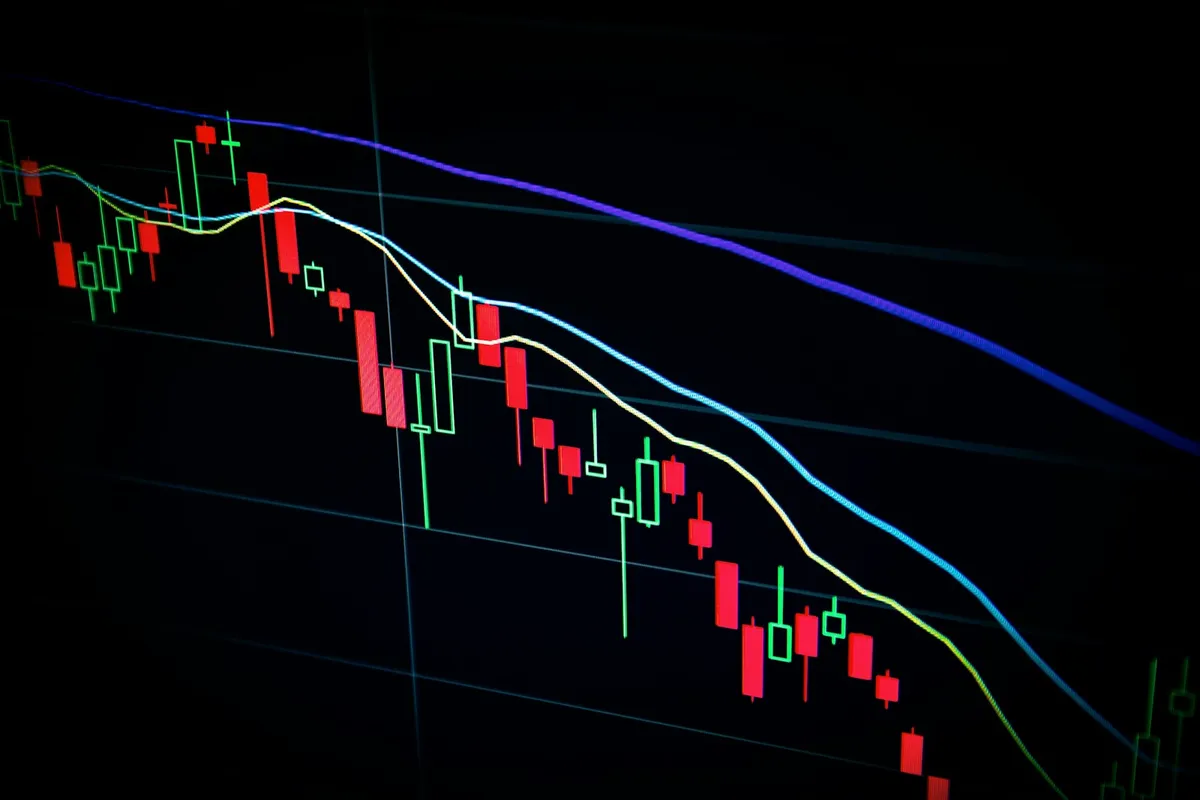
Reading Bollinger Band Squeezes: Spotting Volatility Compression Before the Breakout
Price doesn't go quiet before a big move by accident. When a stock or ETF trades in a tight, low-volatility range for days or weeks, it's building energy for whatever comes next — and Bollinger Bands are one of the cleanest tools for spotting that compression before the crowd notices the breakout.
What a Bollinger Band Squeeze Actually Shows You
Bollinger Bands plot a moving average (typically 20-period) with two bands above and below it, set at a multiple of standard deviation — usually 2. When volatility rises, the bands widen. When volatility falls, they contract. A "squeeze" is simply the visual of those bands pulling tight around price, signaling that realized volatility has dropped to an unusually low level relative to its recent history.
The squeeze itself doesn't tell you direction. It tells you compression — and compression is a statement about energy, not about which way that energy will release. Traders who skip this distinction end up guessing on direction and getting whipsawed when the eventual move doesn't match their assumption.
Measuring the Squeeze Instead of Eyeballing It
A reliable way to quantify band width is Bandwidth, calculated as (Upper Band − Lower Band) / Middle Band. Plot that as its own line beneath price, and a squeeze shows up as Bandwidth dropping to its lowest level in the past several months. Some traders set an explicit threshold — for example, the bottom 10% of the last six months of readings — so the setup becomes a rule rather than a feeling.
This matters because "the bands look tight" is subjective and inconsistent from one chart to the next. A numeric floor keeps you honest about what actually qualifies as a genuine squeeze versus normal day-to-day narrowing that happens constantly and resolves into nothing.
Confirming Direction Before You Commit Risk
Once Bandwidth flags a squeeze, the job shifts to waiting for confirmation rather than anticipating a side. Three things worth layering on top of the bands themselves:
Volume on the break. A genuine breakout tends to arrive with volume meaningfully above the recent average. A band break on thin volume is far more likely to fail and snap back into the range.
Candle close outside the band. A single wick poking through an outer band is noise. A full-bodied close beyond the band, especially on the daily chart, carries more weight than an intraday touch that reverses by the close.
A momentum oscillator agreeing with the move. Pairing the squeeze with RSI or MACD crossing in the same direction as the breakout reduces the odds you're trading a false start. If price breaks up but momentum is rolling over, that disagreement is itself useful information — it's a reason to wait, not a reason to force the trade.
Turning the Setup Into a Trade
For stock or ETF positions, a common approach is entering on the confirmed breakout candle's close, with a stop placed back inside the range — often at the midline moving average or the opposite band, depending on how much room the position needs. For options traders, a squeeze is also a volatility signal in its own right: implied volatility often compresses alongside realized volatility, which can make directional debit spreads or long options comparatively cheaper to enter than they'll be once the move is already underway and IV has expanded with it.
Either way, define your invalidation level before the breakout happens, not after. The entire premise of trading a squeeze is that you don't know the direction in advance — your risk management has to be built to handle being wrong on the first attempt, because squeezes do sometimes produce a false breakout before the real move follows.
Where This Fits Into a Broader Process
A Bollinger squeeze is a screening tool, not a complete system. It tells you where volatility compression exists right now across your watchlist, narrowing hundreds of charts down to a handful worth watching closely for the confirmation signals above. Treat it as the first filter in a repeatable process — scan for the squeeze, wait for volume and close confirmation, check momentum agreement, then size the trade to a defined stop — rather than a standalone signal you act on the moment the bands look tight.
Building that kind of repeatable process is exactly what separates traders who catch these moves consistently from those who spot the setup after the fact and chase a candle that's already moved 4%. If you want help building a rules-based process for reading volatility compression and executing it live rather than in hindsight, start a trial with AJ Monte and see how a structured trading room approaches these setups in real time.
