The best argument for a potential market crash hinges on a toxic brew of overvaluation, weakening fundamentals, and a trigger event, such as a recession, waiting to ignite a panic. Consumer spending, the economy’s backbone, is wobbling, retail sales growth has been anemic, and household debt hit $17.5 trillion last quarter. Meanwhile, the Fed is stuck…inflation is still sticky above 3%, but rate cuts could spark a bond yield spike, hammering overleveraged firms. The yield curve is flirting with inversion again and if you add in an OPEC oil shock or China-Taiwan flare-up, you’ve got a powder keg.
There’s no doubt the S&P 500 has officially entered into correction territory, which is defined as a decline of 10% or more from its most recent peak. While this recent slide has been driven by tariff uncertainty and economic growth concerns following a rapid sell-off, the longer-term technical signals are telling us that prices are still extremely overbought. So where do we go from here?
I’m feeling the same pre-2008 vibes.
While it seems as though retail investors are all-in, margin debt is near record highs, and this is exactly what we saw just prior to the crash of 2008. For months now I’ve been telling our members to turn off the television and turn on the charts, otherwise they could find themselves caught in the next big bull trap. According to my analysis of the markets, we are at the beginning stages of, what could be, a significant and prolonged bear market. Investors will be forced to decide between a) riding it out, and willing to take the hit or b) move to cash, like Warren Buffet, in an effort to create more buying power while waiting for the market to hit a bottom. Most brokerage companies will be quick to tell their clients to stay in the market because the markets always trade back up to new record highs, RIGHT? Well, the truth is, brokers don’t make any money when you are in cash and most of the so-called “brokers” you are speaking with on the phone are in their late 20s to early 30s, barely remembering what was covered on the Series 7 Exam they took to become a broker. In fact, if you are having your money managed by a money manager, here’s a good question to ask them: Hey “Joe”, how far down would the S&P have to drop before you move me out of the market and into cash?
Fact #1- You can’t lose money taking profits.
Fact #2- You can’t make a fortune without managing risk.
Fear & Greed drive the market but being greedy in a fearful market can hurt you. In other words, if you are not paying attention to the signals and you decide to hold on when panic starts creeping into the markets, it could take many years before you get back to your breakeven point. Just ask anyone who held on during the crash of 2000. It took 13 years before the market broke out over the 1999-2000 highs. Keep your eyes on the charts because the price action doesn’t lie.
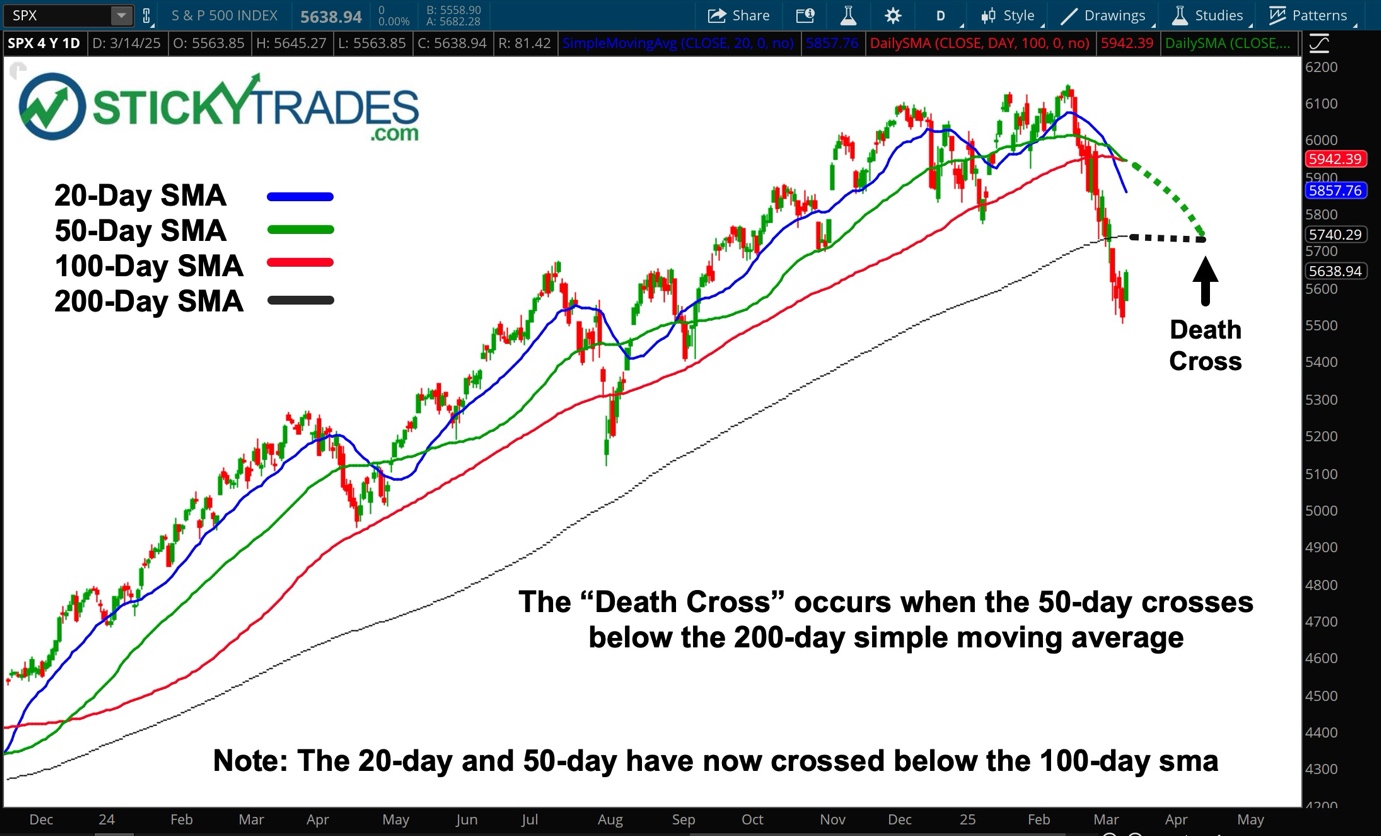
Below is a daily candle chart of the S&P 500 Index and as you can see, the price action is now trading below the 200-day moving average. Computer selling (aka algorithmic selling) is not affected by what is being said on the financial programs. The algorithms are triggered by data feeds, therefore, when prices begin to cross below key moving averages algorithms enter sell orders into the market. As the price action continues to trade below the 200-day SMA, the 20, 50 and 100-day moving averages are drawn down towards the 200-day SMA. In technical analysis, a death cross is a bearish signal which occurs when the shorter-term moving average (50) crosses below the longer-term moving average (200). It’s a warning sign that momentum has shifted downward, suggesting a potential sustained decline or even a crash. Traders see it as a confirmation that sellers are taking control of the major trend, and this often triggers more selling pressure as fear kicks in.
Turn off the TV and Turn on your Charts – We are entering a Bear Market


